
Open a site report
- Go to Dashboard and select the site’s title in its Connected sites card.
- Review the daily page-view chart and the metric tiles.
- Use the date-range control inside the report to switch between 7, 28, 30, and 90 days.
- Scroll through the breakdowns below the chart. Close the dialog to return to your portfolio.
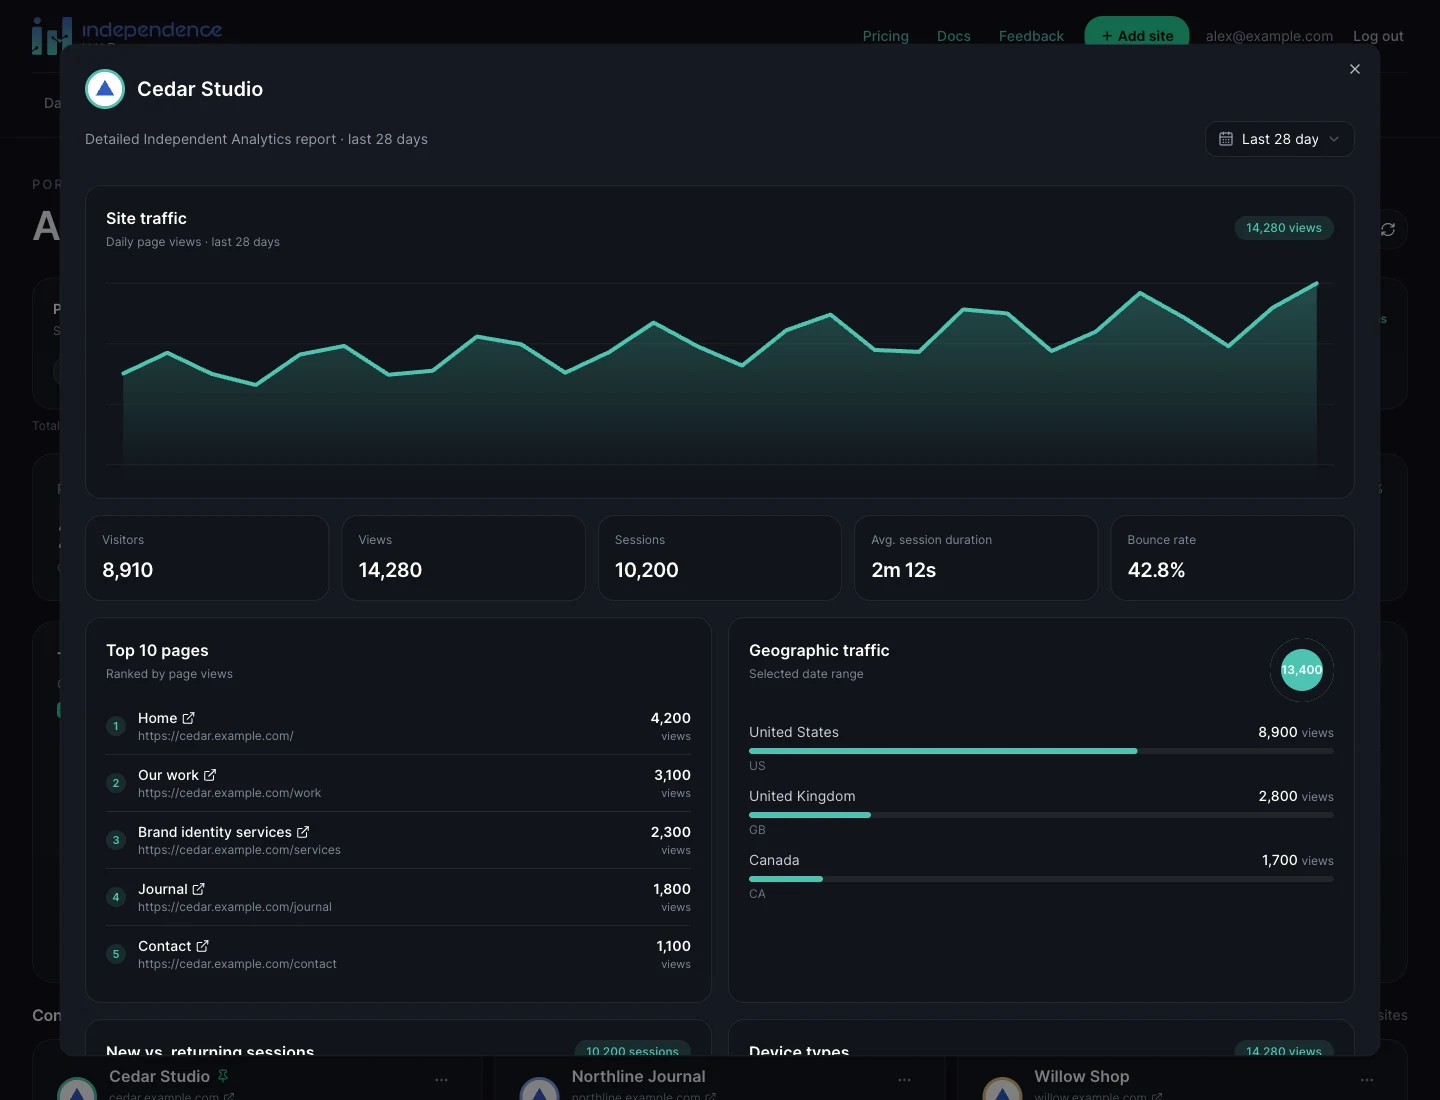
What the metrics mean
These are aggregate reports from your site’s Independent Analytics installation. The Hub does not expose a list of individual visitors.
| Metric | How to read it |
|---|---|
| Views | Page views counted by Independent Analytics in the selected period. |
| Visitors | The visitor count reported by Independent Analytics for this site and period. |
| Sessions | Visits reported by Independent Analytics; a visitor may have more than one session. |
| Avg. session duration | The average session length reported by the site, displayed in minutes and seconds. |
| Bounce rate | The percentage of sessions that Independent Analytics classifies as bounces. |
Explore the breakdowns
A breakdown can be empty even when other metrics are available. Compare the same dates in WordPress before assuming the connection is broken. If the detailed report cannot load, update the connector and try again.
- Top 10 pages ranks pages by views. Select a linked page title or URL to open that page in a new tab.
- Geographic traffic shows where traffic comes from, grouped by country.
- New vs. returning sessions compares session types, rather than a cross-site count of people.
- Device types shows the distribution of page views across the reported device categories.
- Top traffic sources helps you see which sources send page views to the site.