
Review the Opportunity Radar
Insights uses your saved dashboard date range. To change the comparison period, select a different range on Dashboard, then return to Insights.
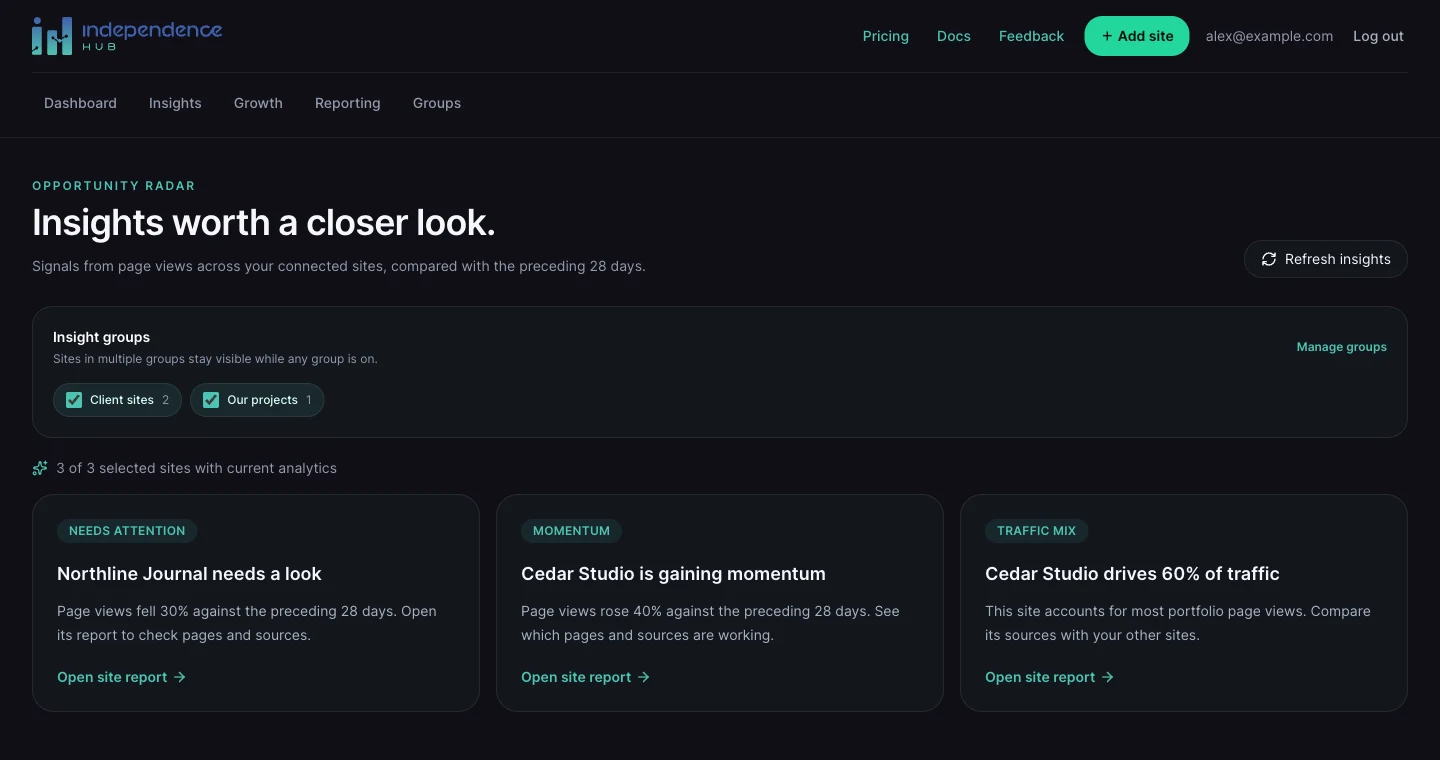
- Choose Insights in the app navigation.
- Use Insight groups to include the clients or portfolios you want to review.
- Read the signal cards and use their links to investigate a site on the dashboard.
- Choose Refresh insights to request updated analytics.
Understand each signal
| Signal | When it appears |
|---|---|
| Needs attention | The largest qualifying page-view decline of at least 15%. |
| Momentum | The largest qualifying page-view increase of at least 15%. |
| Traffic mix | With at least two ready sites, one site contributes at least half of selected portfolio page views. |
| A steady portfolio pulse | No qualifying change signal or traffic concentration signal was found. |
| Your first baseline is ready | More comparison-period traffic is needed before a growth or decline signal can be assessed. |
Turn a signal into a next step
For a decline, open the site report and check its top pages and sources. For momentum, look for the content or source that is contributing to growth. If one site drives most traffic, consider how dependent the portfolio is on that site.
These signals identify changes; they do not explain their cause. To track your own threshold or get optional email notifications, create a rule in Growth’s Traffic watchlist.