
Build your portfolio brief
- Open Reporting. If you see Explore Unlimited, review the plan options to enable custom printable reports.
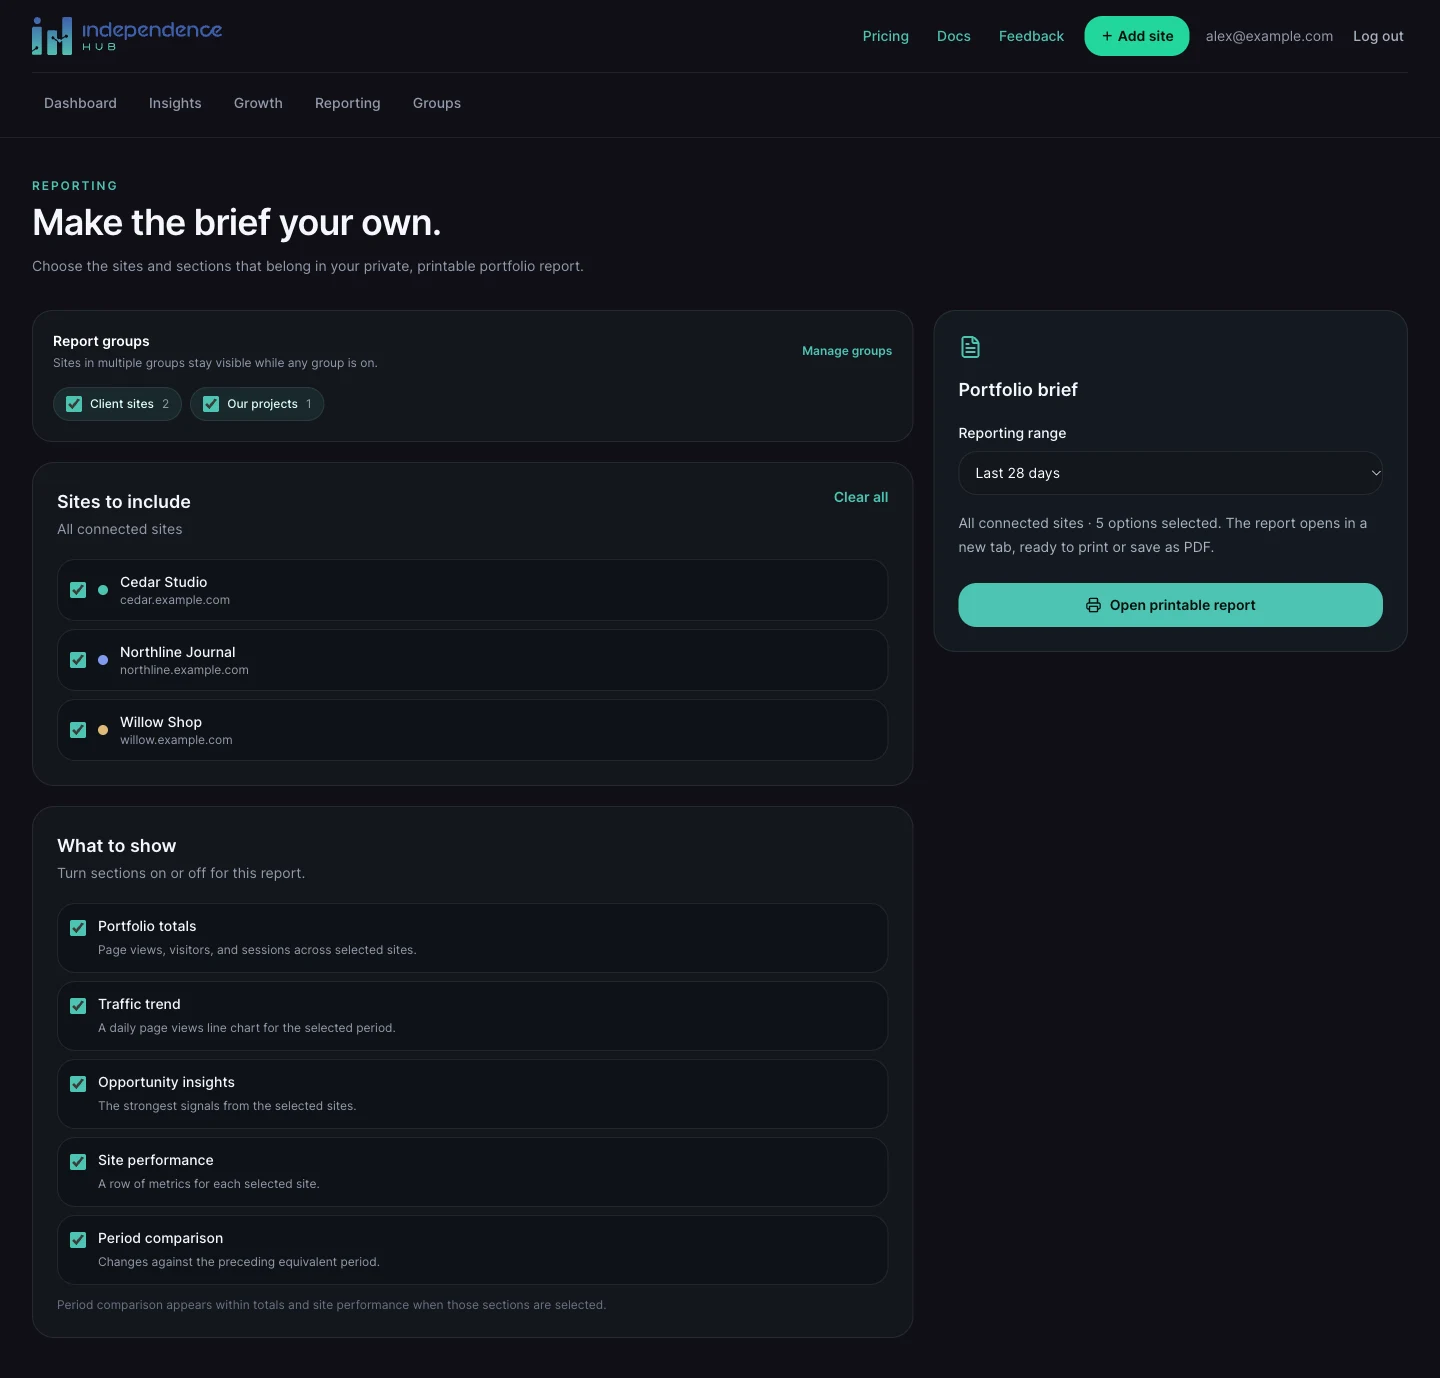
- Use Report groups to start with a client or portfolio, then fine-tune the checkboxes under Sites to include. Select all and Clear all provide a quick reset.
- Under What to show, select the sections you need.
- Choose Last 7, 28, 30, or 90 days in Reporting range.
- Choose Open printable report. The brief opens in a new tab.
Choose the right sections
| Section | Included information |
|---|---|
| Portfolio totals | Page views, visitors, and sessions summed across your selected sites. |
| Traffic trend | Daily combined page views during the selected period. |
| Opportunity insights | The strongest available signals for the selected sites. |
| Site performance | A metrics row for each selected site. |
| Period comparison | Changes against the previous equivalent period, shown within totals and site performance. |
Print or save as a PDF
The brief is private and generated from your signed-in account. Share an exported PDF when you need to send the report to someone else. Its contents reflect the report at the time you generated it.
If the new tab does not open, allow pop-ups for the Hub and try again. Changing the report’s range does not change your saved dashboard reporting preference.
- Review the report in its new tab and check any unavailable-data warnings.
- Open the browser’s print dialog with the report’s print control or Ctrl+P (Windows) / Command+P (Mac).
- Choose a printer, or select Save as PDF from the available printer/destination options.
- Check the print preview, then print or save the file.