
Read your portfolio overview
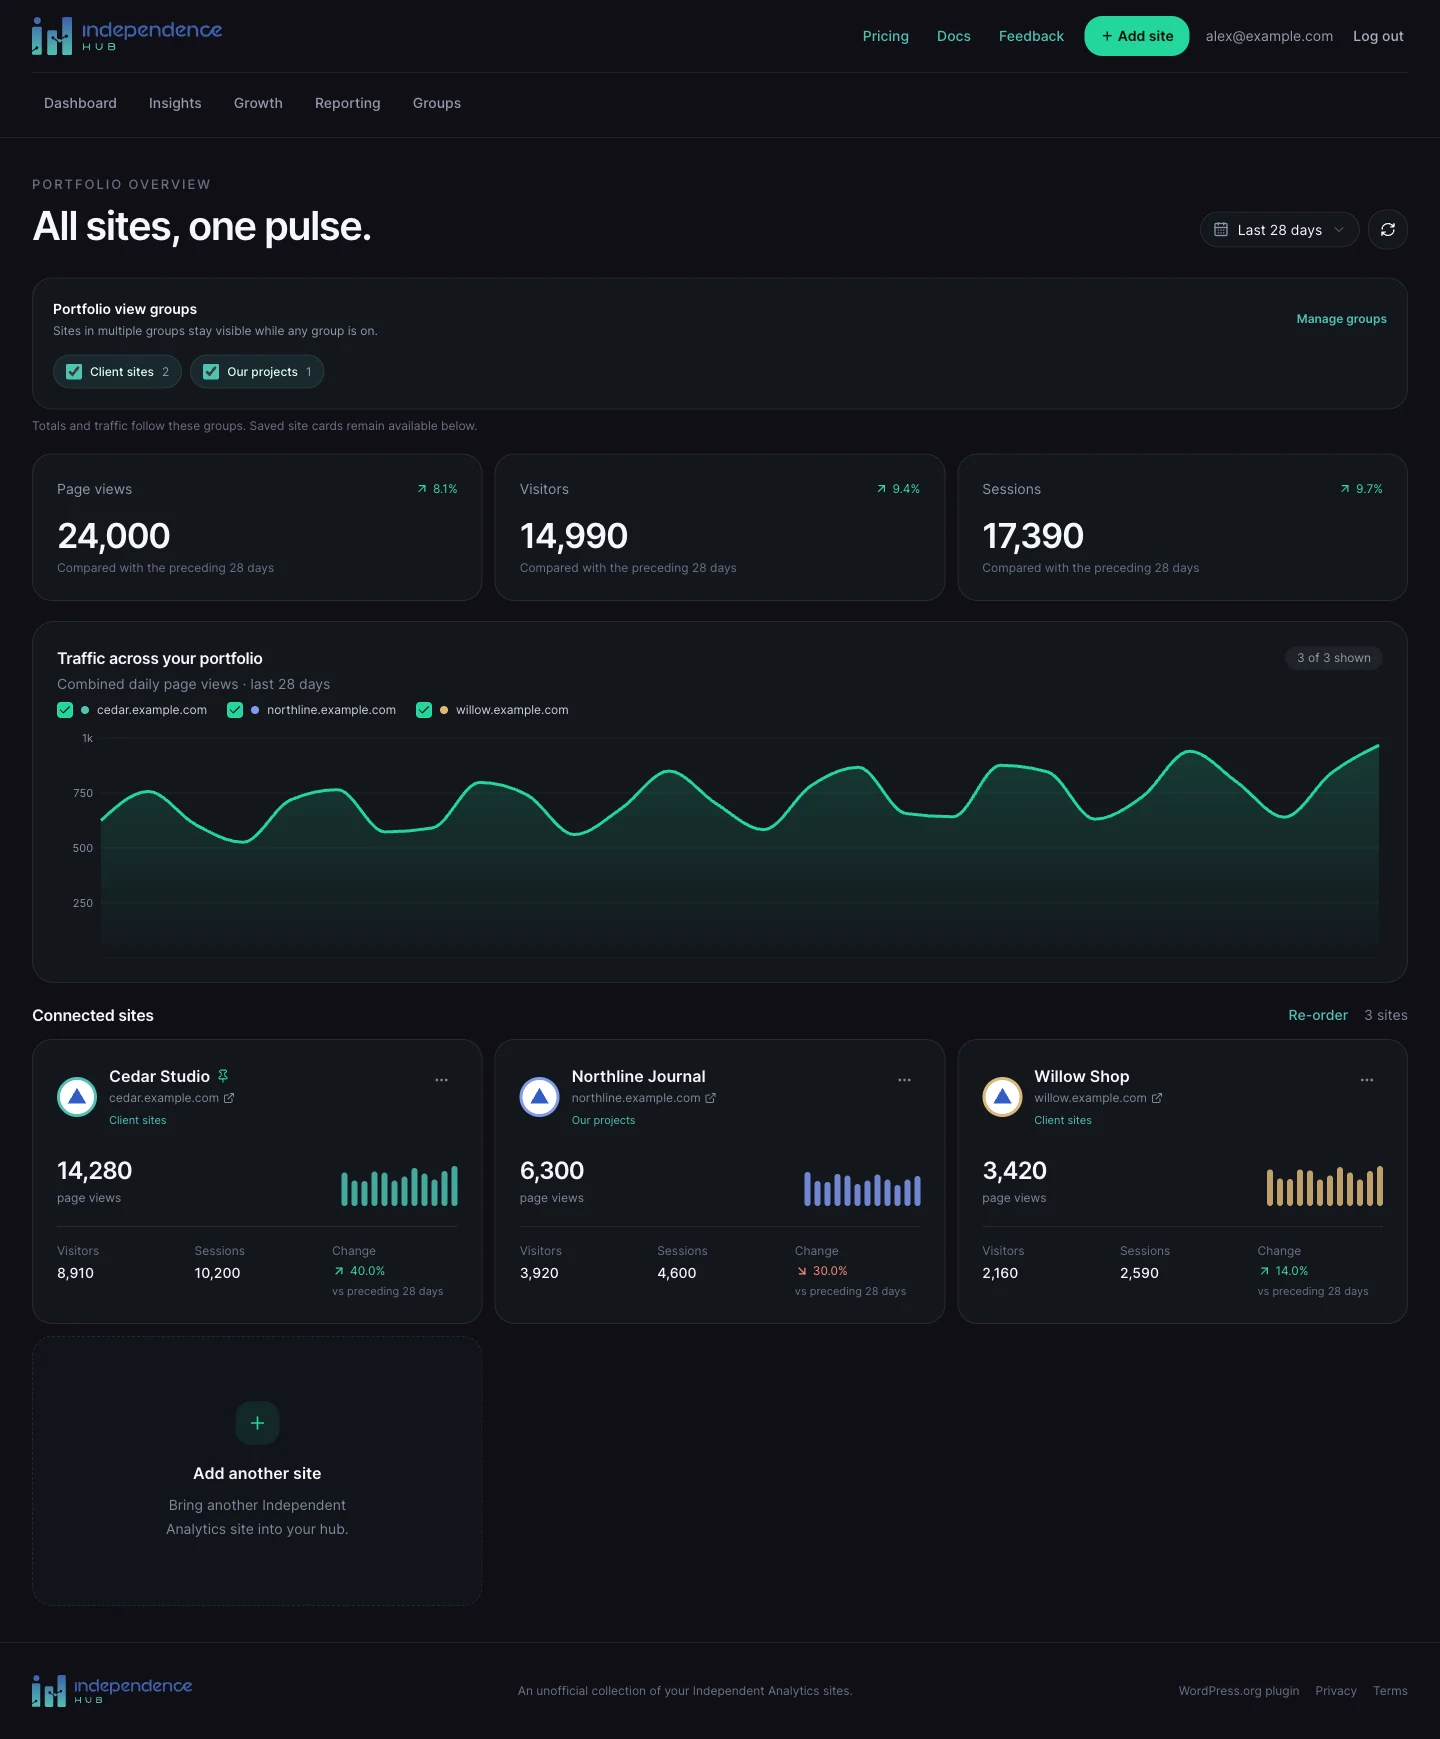
Dashboard opens with page views, visitors, and sessions across the sites included by your group filters. Each percentage compares that total with the immediately preceding period of the same length.
Choose Last 7, 28, 30, or 90 days at the top right. Your dashboard reporting range is saved to your account. The current period includes today’s partial traffic in each site’s timezone, so it can continue to change throughout the day.
Choose what the overview shows
A site in multiple groups stays included while any of its groups is on. Ungrouped contains sites with no group memberships. If every domain is unchecked, select at least one to bring the chart back.
| Control | What changes |
|---|---|
| Portfolio view groups | The totals and traffic chart follow the included groups. Saved site cards remain below. |
| Domain checkboxes above the chart | Only the traffic chart changes. Totals, saved connections, and site cards stay as they are. |
| Chart hover | Shows that day’s combined page views and the selected sites’ contributions. |
| Refresh traffic data | Requests updated analytics for the selected reporting range. |
Use your site cards
The small bars summarize recent daily page views. The Change value compares that site’s page views with its previous equivalent period.
- Select a site’s title to open its detailed report (Unlimited).
- Select the domain below the title to visit the WordPress site in a new tab.
- Use the three-dot actions menu to Pin to top, Set site color, manage group memberships, or Remove site.
- Use Reconnect site when the card indicates that its connection has been revoked.
Pin and reorder your sites
Sites use alphabetical ordering where no custom order has been saved. Pinning and site colors are saved to your account.
- Choose Pin to top from a site’s actions menu to keep it above unpinned sites.
- Choose Re-order beside Connected sites to reveal the drag grips.
- Drag a grip to move its card, or focus the grip and use its arrow keys. Pinned and unpinned cards reorder within their own sections.
- Wait for the save to finish, then choose Done.
Understand cached and paused data
The Hub normally reuses recent analytics for up to 15 minutes. Use the refresh button when you need a new check. If a request fails, a card may show the last successful snapshot with a warning.
Analytics paused for this site means the connection is preserved but is outside the active site allowance of your current plan. See Pricing to restore access with Unlimited.